See it on a real network
No council uses PaveKeep yet, so everything below runs on a demonstration network: 9 roads, 94 segments, real geometry, real surveys — and 8 segments nobody surveyed, which still report as unknown rather than as zero.
That last detail is the point of showing you a demonstration rather than a brochure. The gaps are in it.
Three minutes, in three parts
The cuts are silent and caption-led, so they work with the sound off.
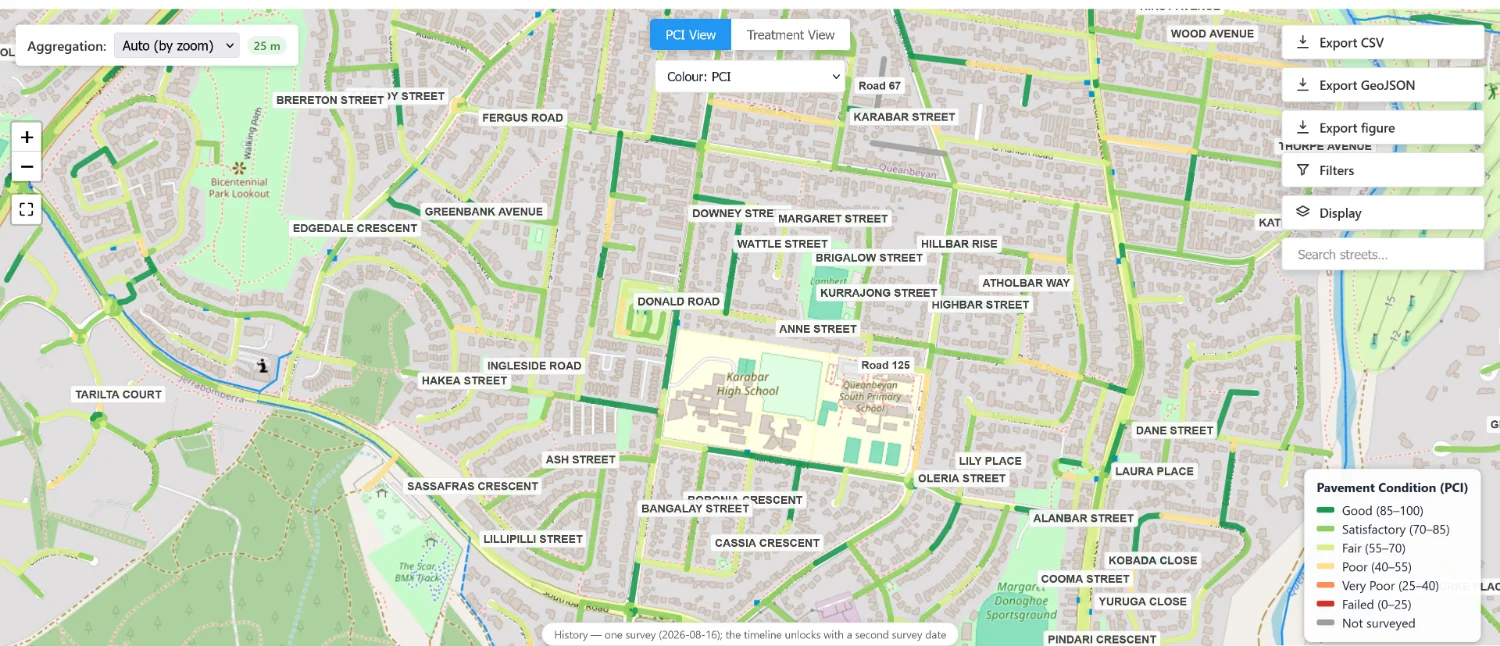
The network, on a map
Every segment carries its own condition, and the legend has a row for not surveyed. A road nobody has looked at is grey, not red and not green.
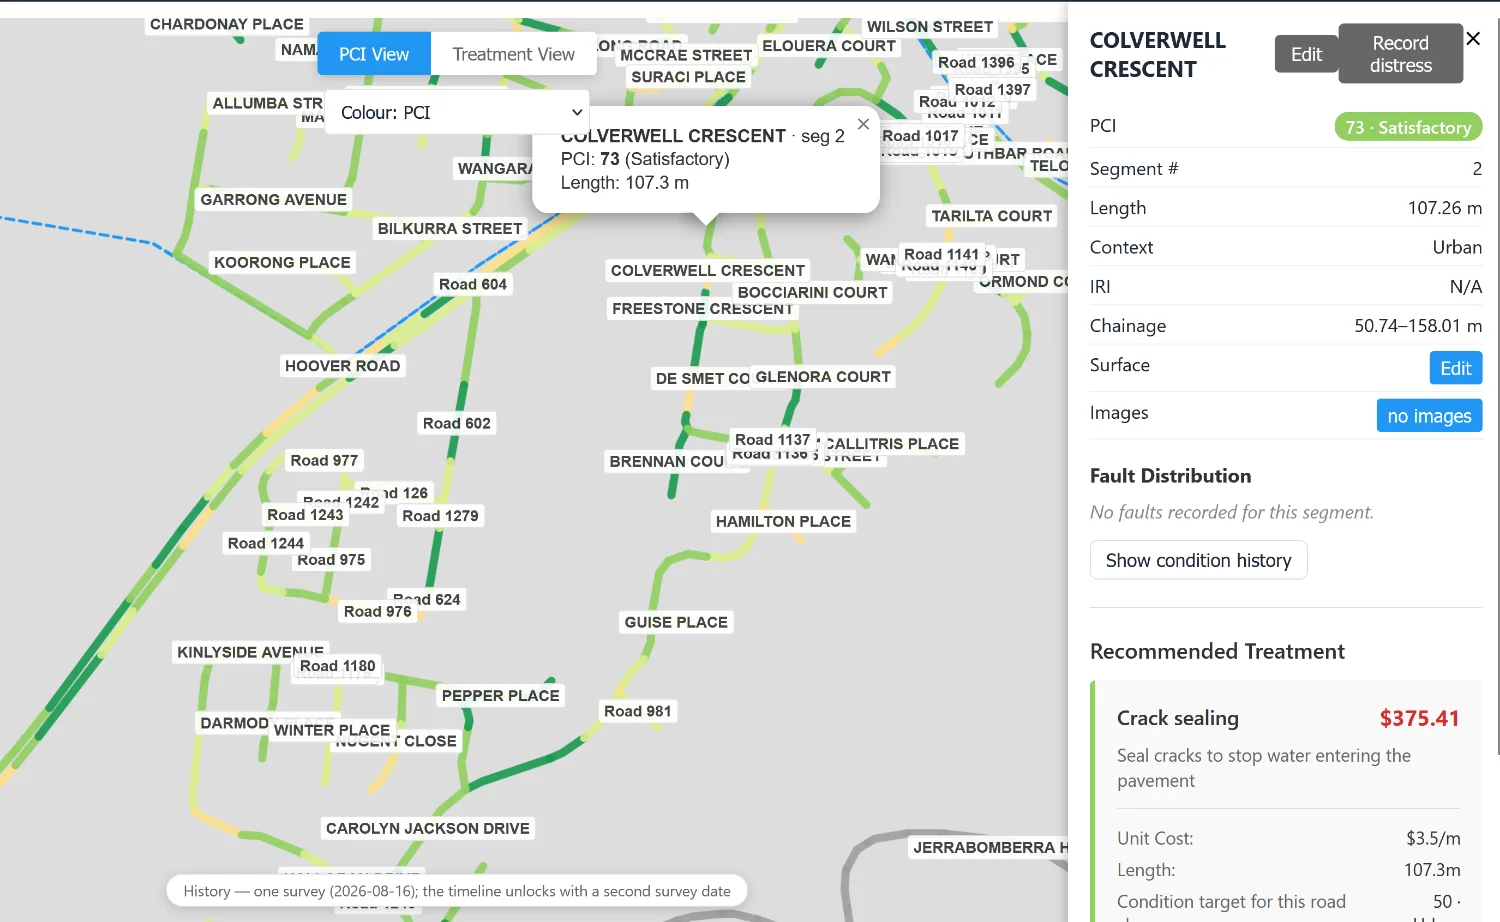
Open any segment and it says what was seen, when, and by which method.
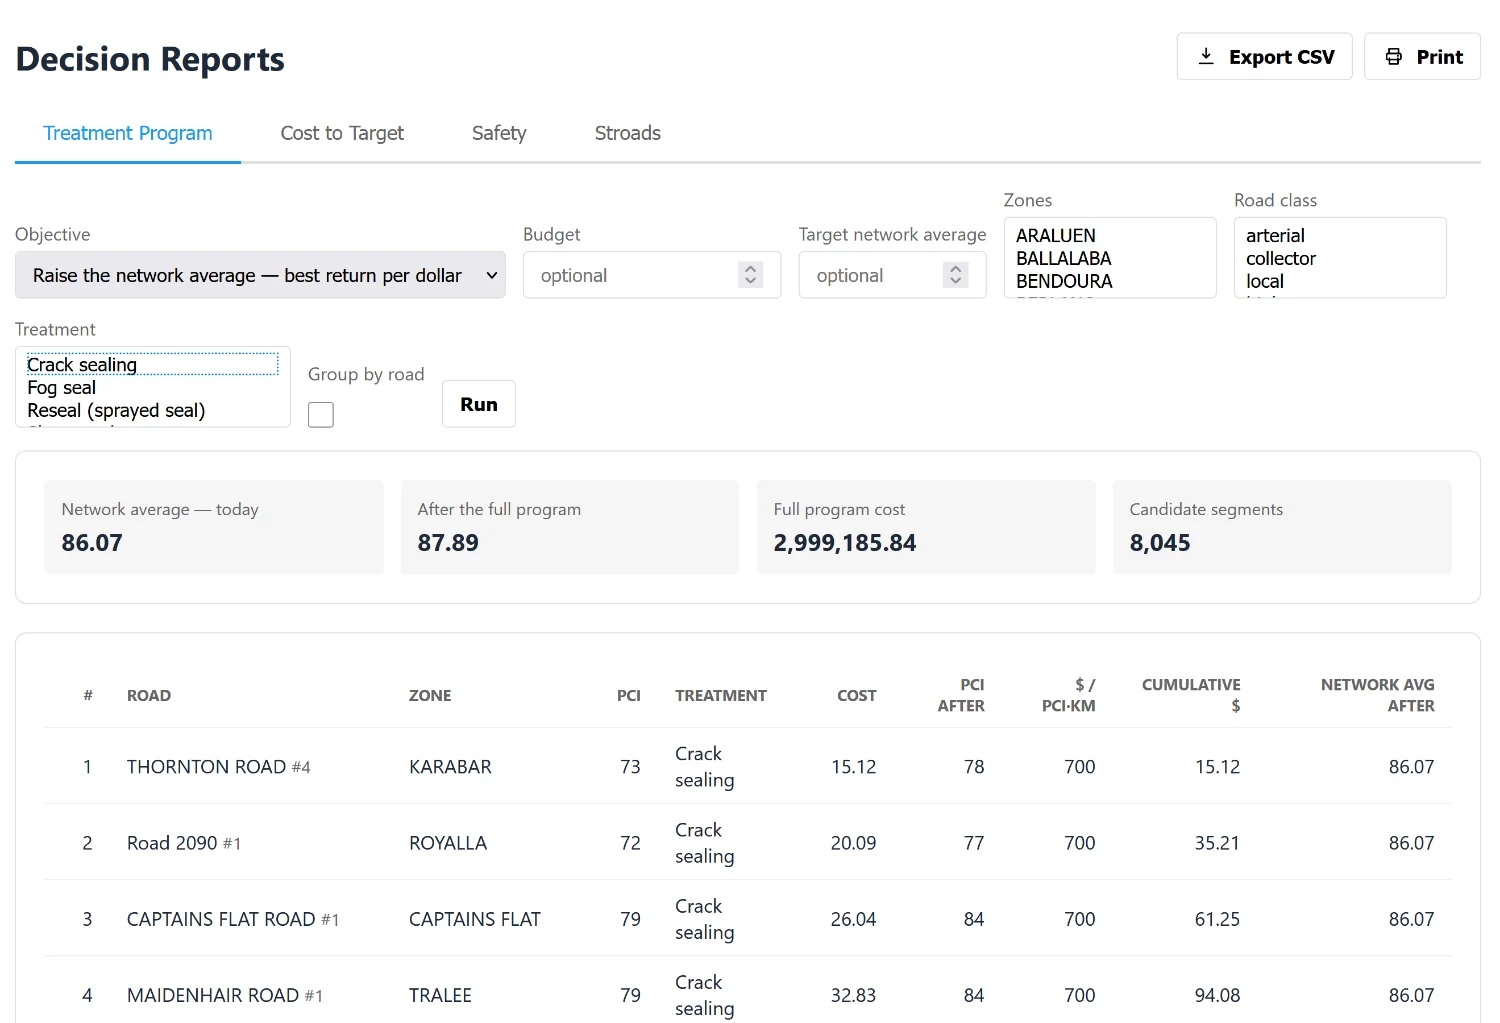
What to fix, in what order, at what cost
A ranked, costed list. Each row carries the treatment, what it costs, what the condition becomes afterwards, and what the network average would be if the programme ran to that line.
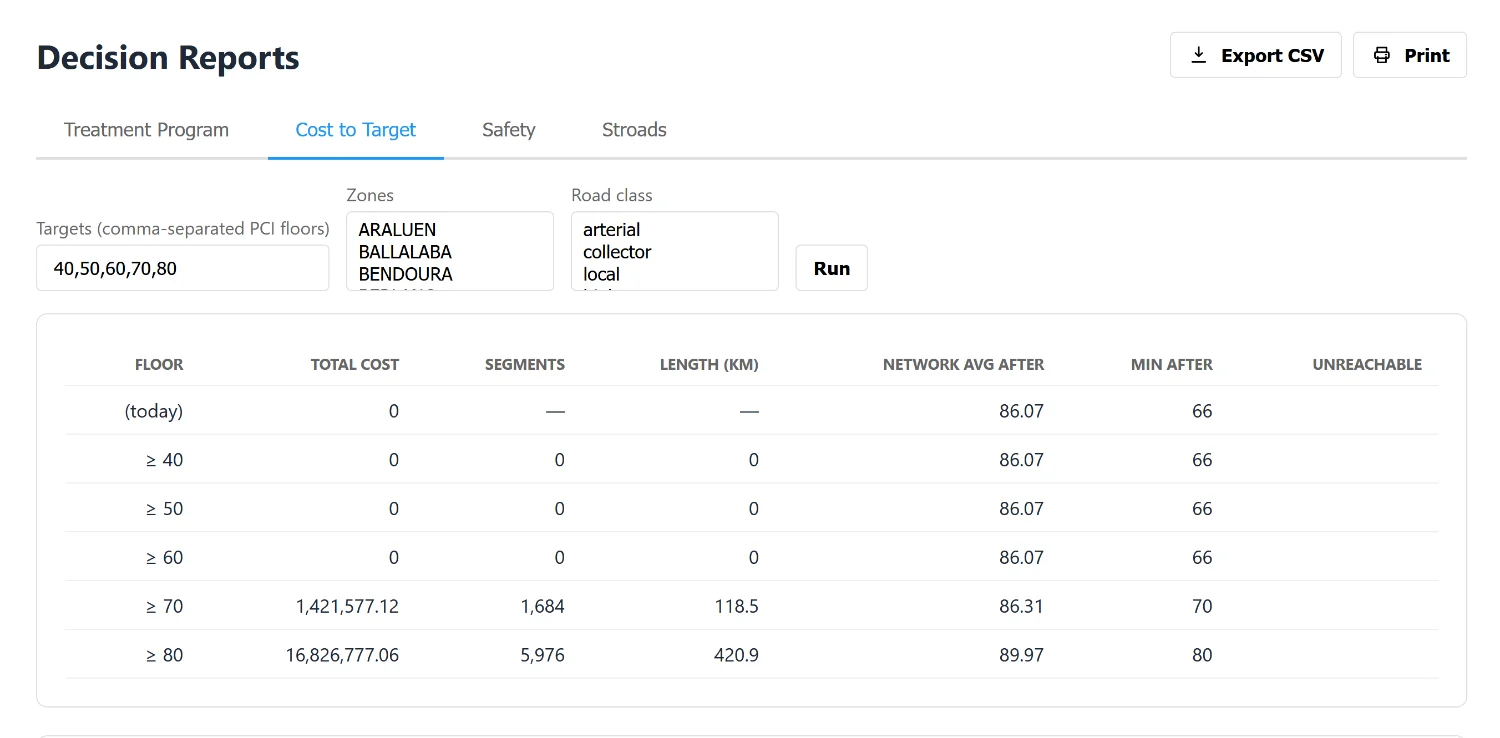
Put in a budget and a number of years and see what it buys — and what a different budget would have bought instead.
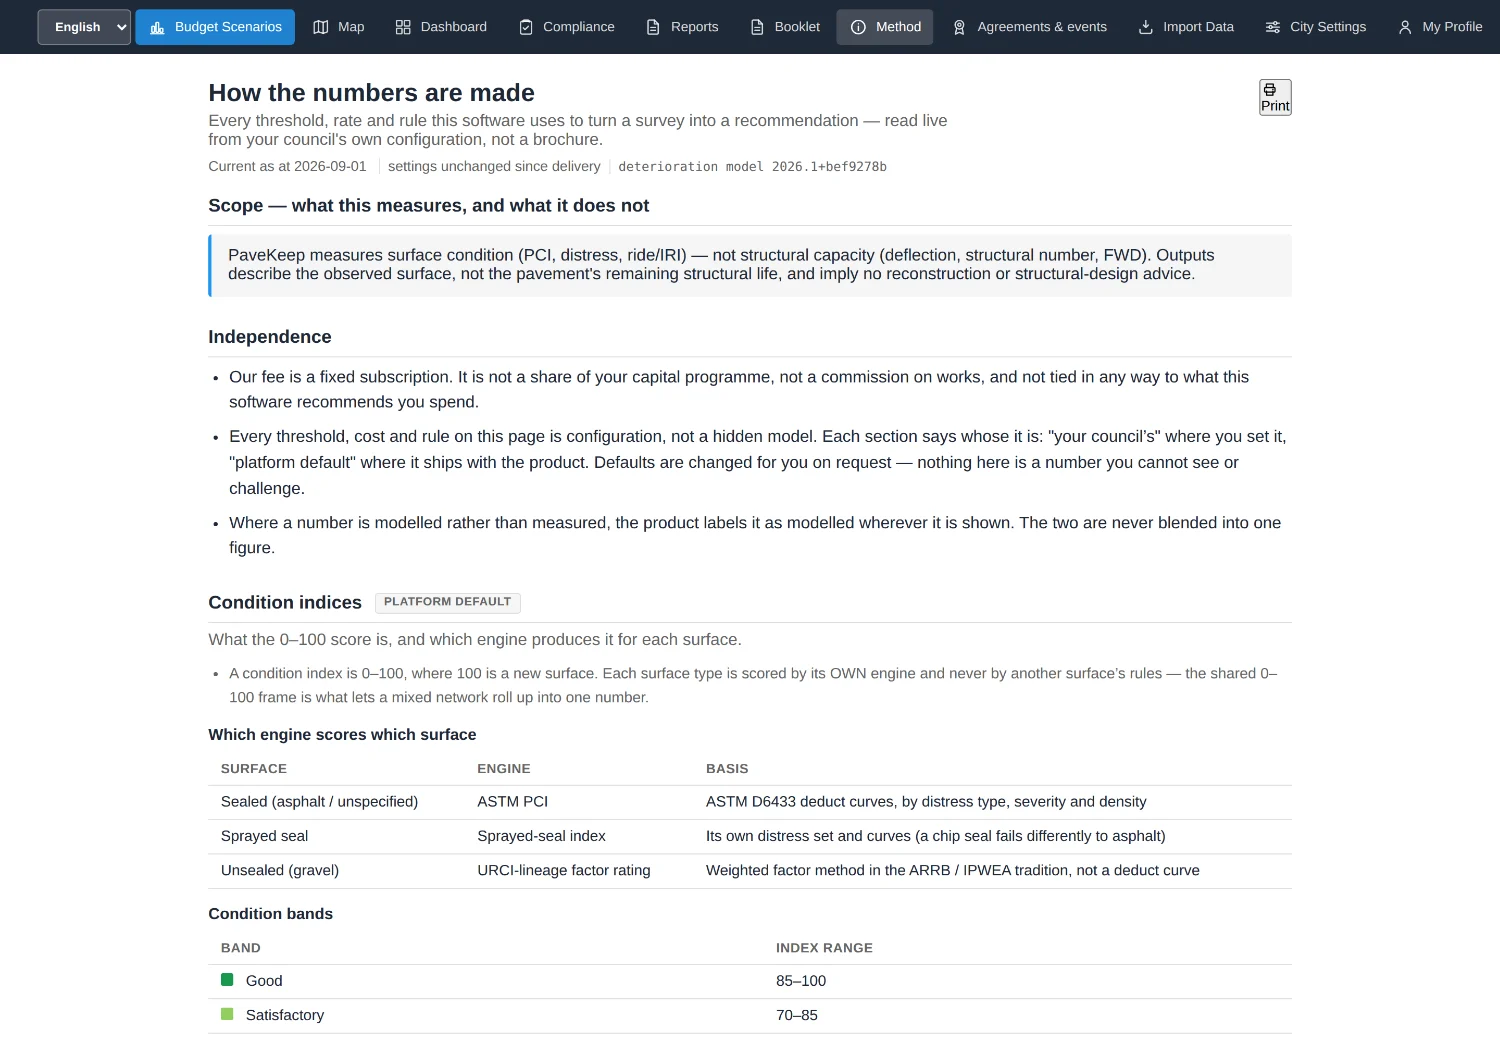
Where the numbers come from
Every threshold, rate and rule the software uses, read live from the council's own configuration rather than from a brochure. Including the ones it does not use yet, which are on the same page.
What a council actually sends
The same data becomes a committee paper, a short brief for a general manager, and a grant submission — each written for the person who reads it.
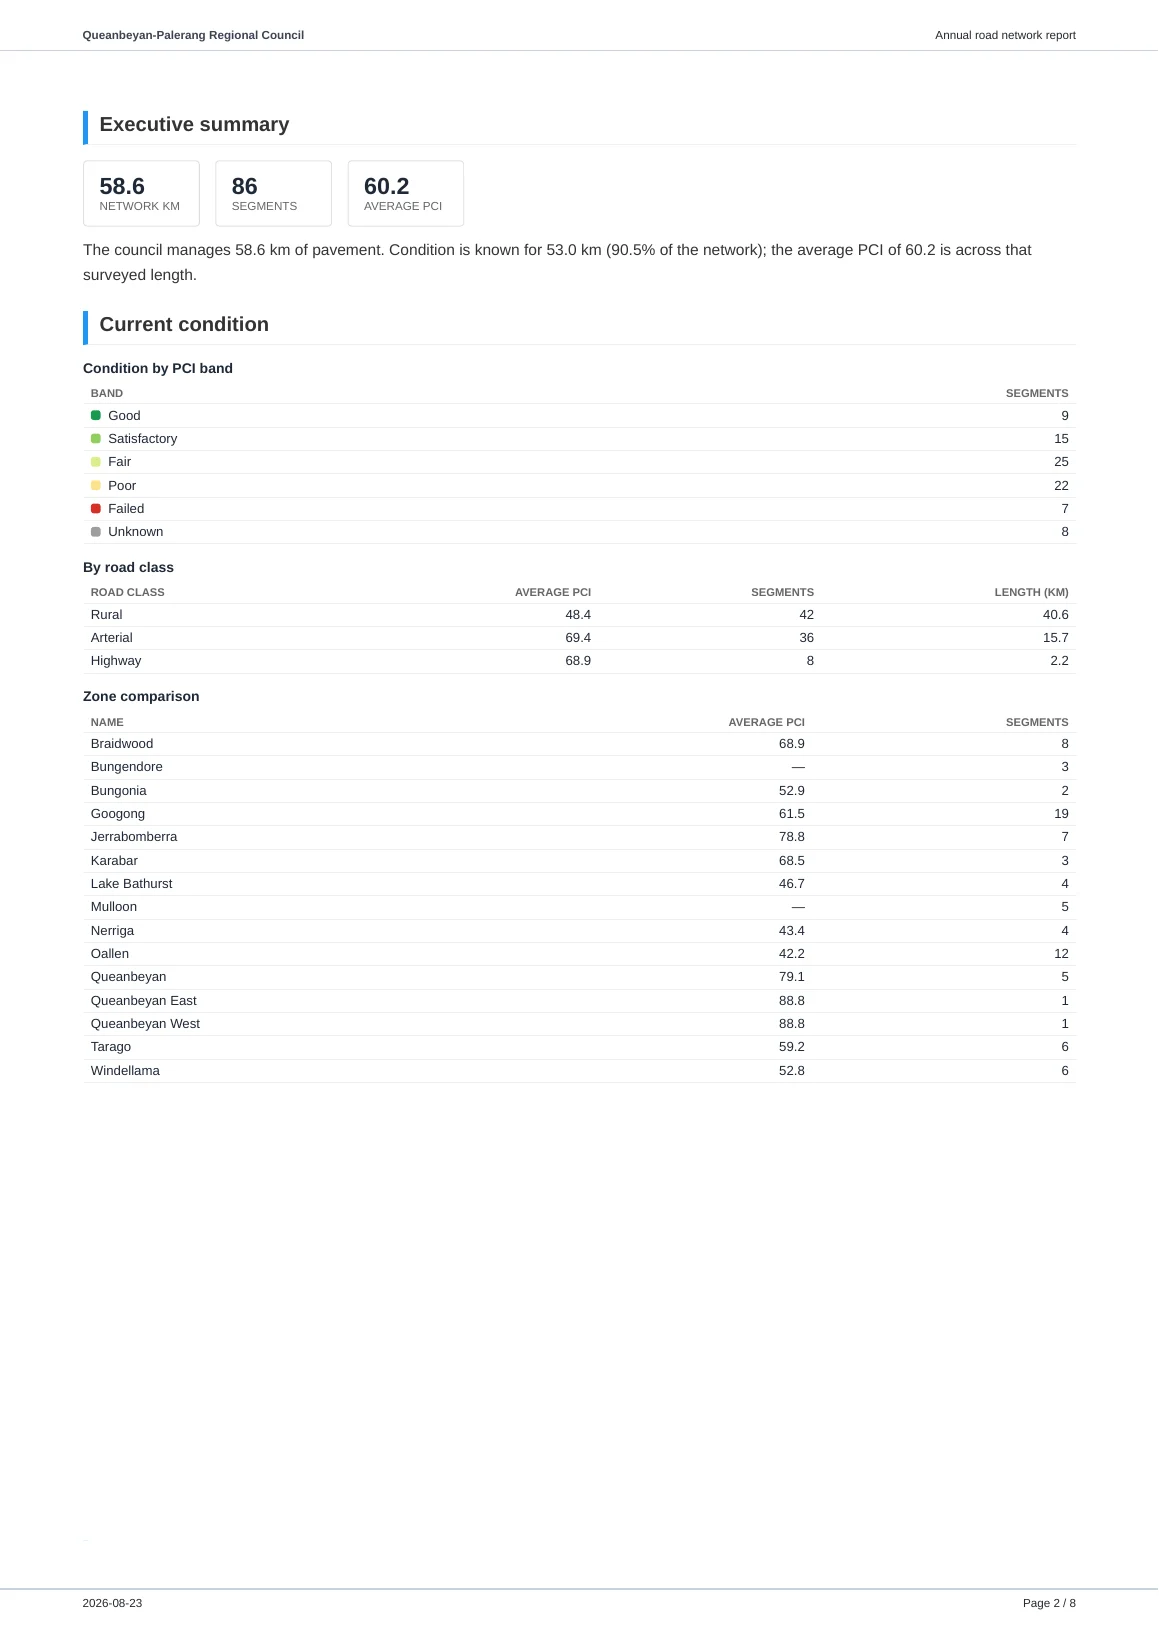
The real files are on the proof page, not as pictures but as the PDFs themselves.
Seeing it on your own network
A walkthrough of the demonstration network takes about twenty minutes and is the fastest way to find out whether any of this is useful to your council. There is nothing to install and nothing to sign.
Accounts are by invitation — self-service sign-up is switched off in the product’s own configuration, so a council gets one by asking.